

FED DONE: WHAT NEXT?
I haven't seen this kind of complacency

Just about everyone is bullish and the market did not crater on the Fed report. Lots of twists and turns just to get us to the tip of the iceberg so lets take a deeper dive. I’m seeing some smart traders on Twitter (there are a handful) who are split as to what they think is going to happen. Anyone heard of Mark Minervini? He issued a sell signal on November 22, 2021 which was the 664 week high in the NASDAQ and issued a buy in early January. Then there is someone called Godzilla Trader who is also very good and this guy is completely bearish. These are kinds of people I respect and they are not on the same page.
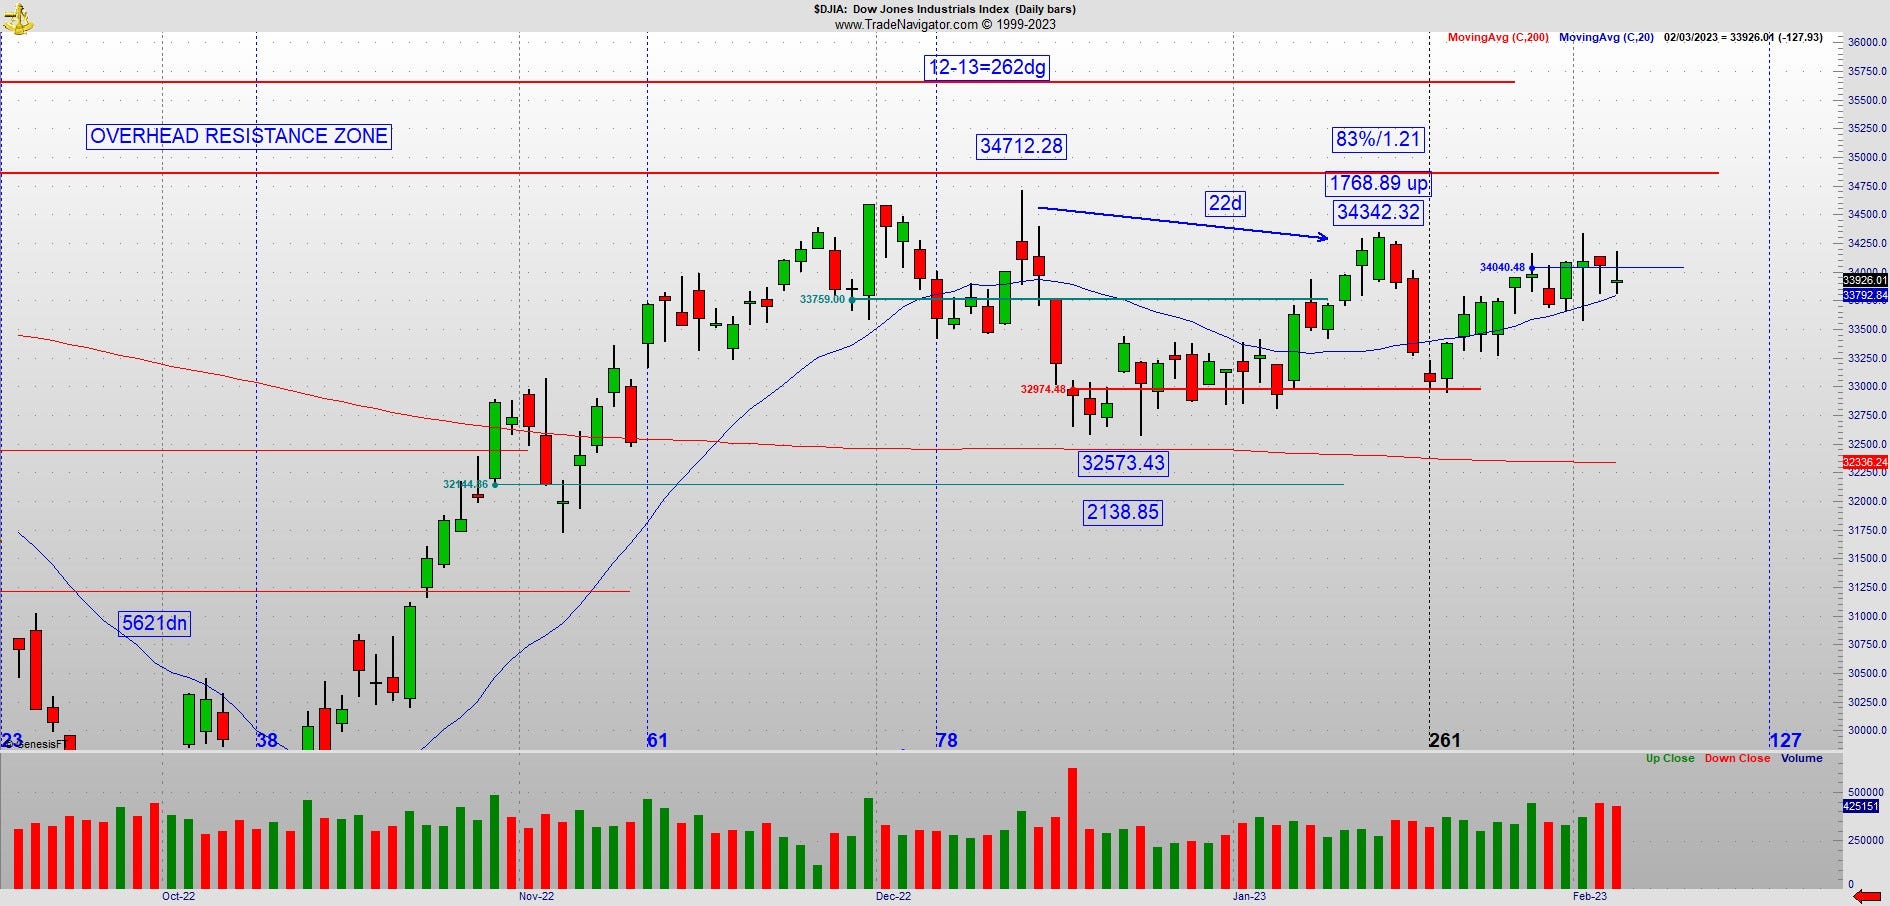
What to do about this? Of 2 choices, I always pick the 3rd. In this case it means watching the Dow, looking at that band of overhead resistance which has never been tested in over 2 months and not make the big decision until I see that test. Right now the Dow still holds that December 13 high which is the 262dg vibrational day of the year. It carries a lot of weight. Everything considered, I lean bearish.
It was explained in some article I read that Wall Street money managers are not penalized for losing money in a bear market. But they are penalized for missing out on a bull move. That has to explain at least partially why they are trying to take it higher.
So when Powell came out with that purple tie and only 25bps, it was dovish. I enjoy reading Godzilla Trader’s tweets. He says its a thing when Powell wears a purple tie that means he’s dovish, when he wears a blue tie, that’s hawkish. He claims this has worked every time. You know I don’t follow these things but waiting for my trading setups takes a lot of patience and I need entertainment or I might go FOMO. As an aside my wife gives me crap for hanging on Twitter. watching as much hockey as I do and then 2 hours of John Wells 3 or 4 nights a week. What is a person supposed to do? I do alot of tracking on 1 and 4 minute all day long and it requires a lot of patience. Patience is tough so I keep myself occupied because its just Maxie and I.
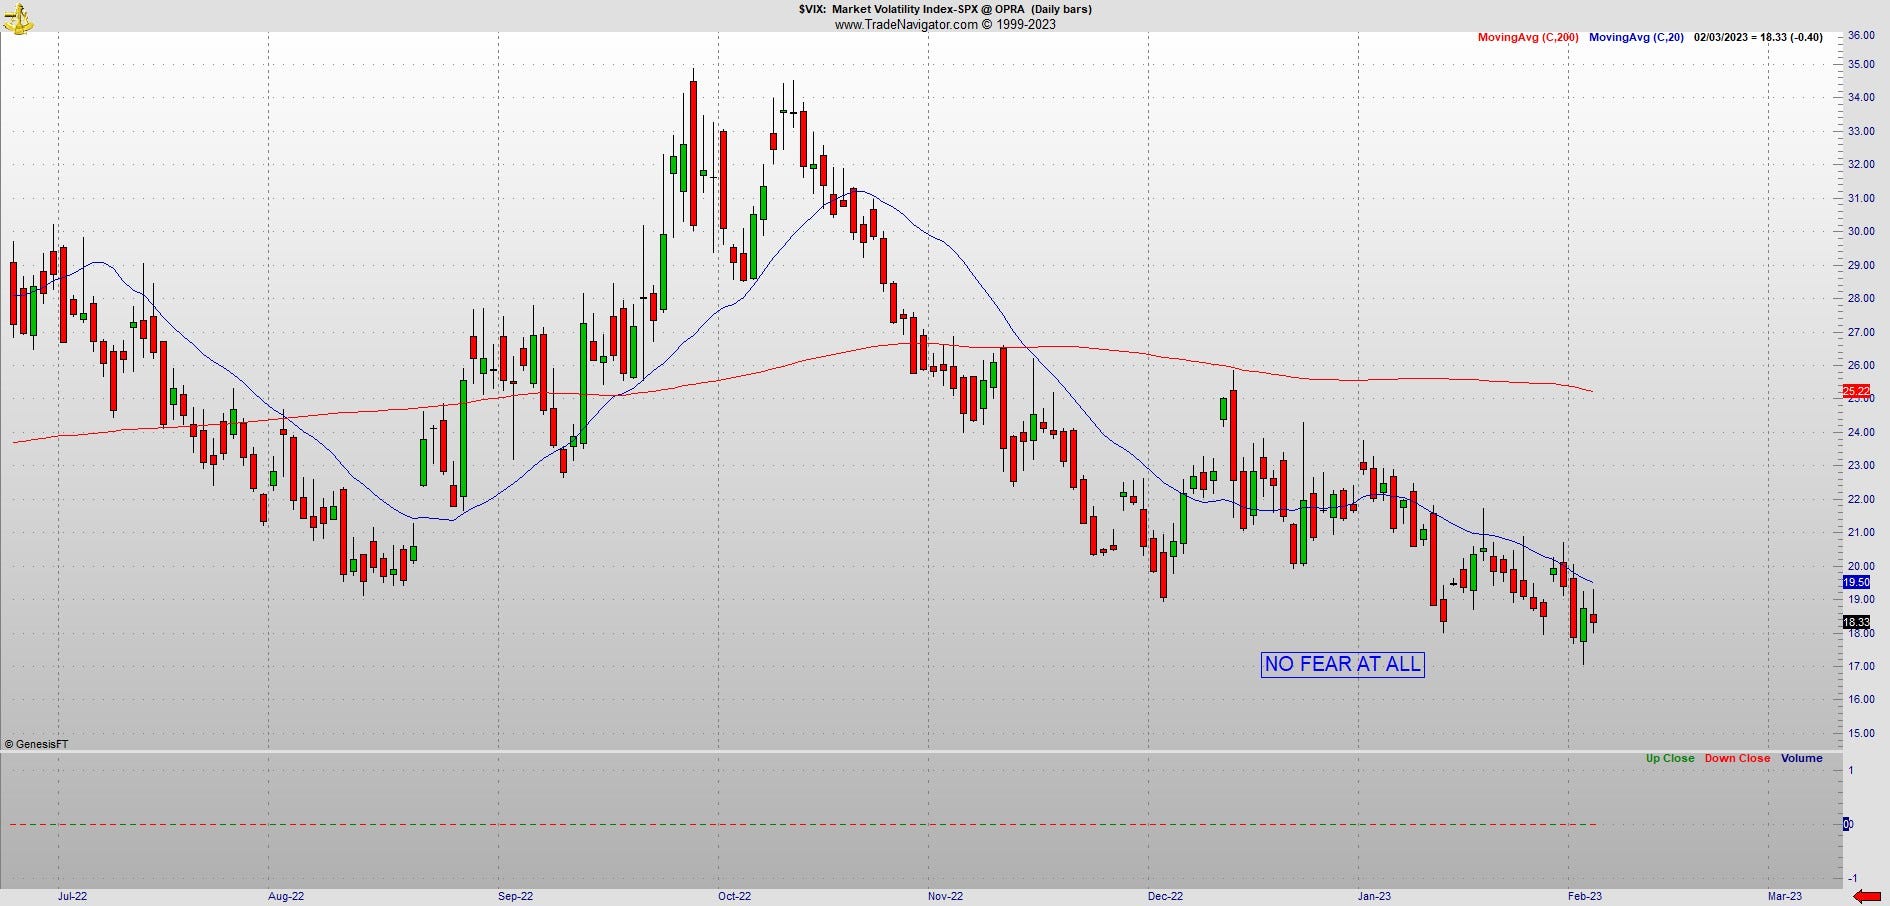
What is the point of all this? Sometimes you just have to sit back and take it all in as an observer. As a person who monitors mass crowd psychology I’m here to tell you the bullishness reached insanity levels when Powell chose the smaller hike. Look at that VIX, the last time it was lower than this was Jan 5, 2022 and prior November 21, 2021.
You’ll recognize those dates as the two market peaks. So we could be there but in case we aren’t, do you really think we could get a huge bull move starting from where the VIX is right now?
In 1999, everyone was not only bullish, they were euphoric. Cab drivers and waiters were suddenly stock traders. That’s not happening now but what is happening is ordinary housewives do represent themselves at crypto experts and we know that’s not possible. Its different in the stock market, there was some flash of euphoria on Wednesday but what I see is an uncommon stubbornness that everything is going higher. One tweet showed a drawing of an explosion with a little Bitcoin logo that read Bitcoin 73000 in 2023. It’s not euphoria, its greed taken to an extreme level. I’ve never seen so many people taken by the chance to get rich quick when it comes to crypto.
Look, Bitcoin may very well go to 73000, but I’m not comfortable with people being so bold to predict things like that when it has only one rally leg off the bottom. If it really is going to gain 50,000 pts, there should be more denial of the rally. You know that, I know that. That’s what we are dealing with. I now think what is going on here is more insane than the tech mania in 1999. It seems more one sided than last time if that’s even possible. I’ve never seen anything like this before and one person pontificated we might be heading to the 100 year crash scenario. Given everything I’ve seen its amazing to me the market has stayed up this long. So here’s the Dow and the only thing I could add is the high in January has a vibration tying it to the high in December at 22 days and a slash line of 83%/1.21. In 14 trading days that has not been taken out.
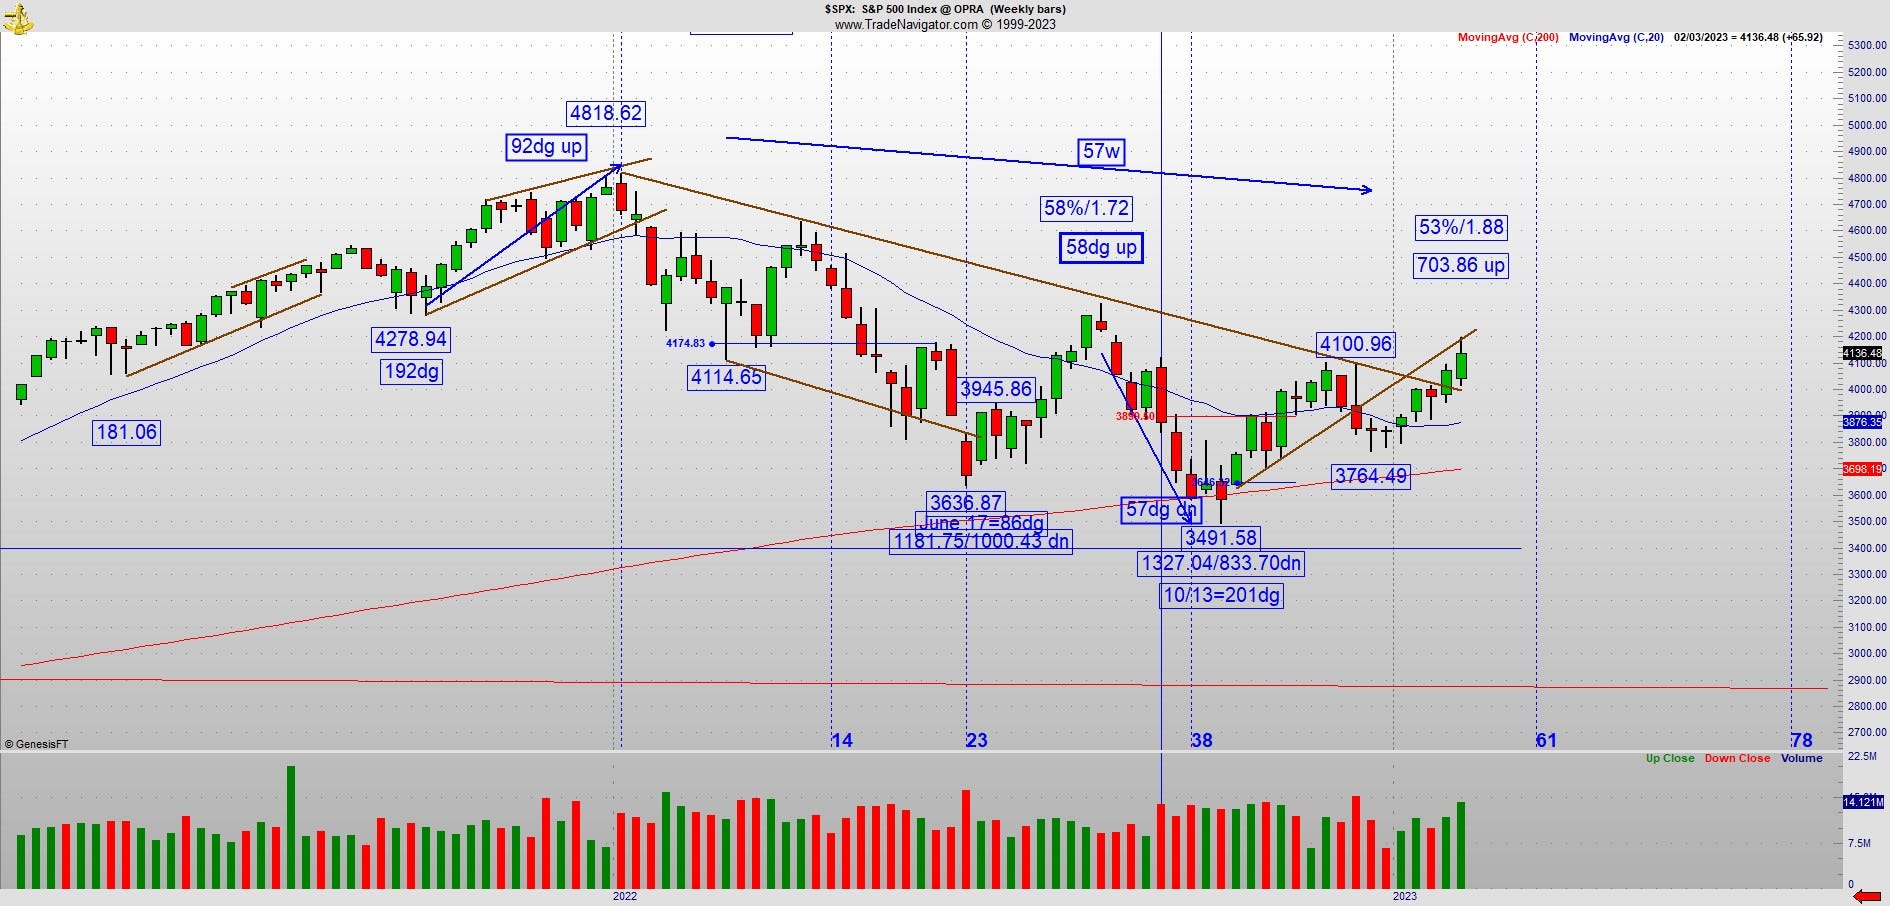
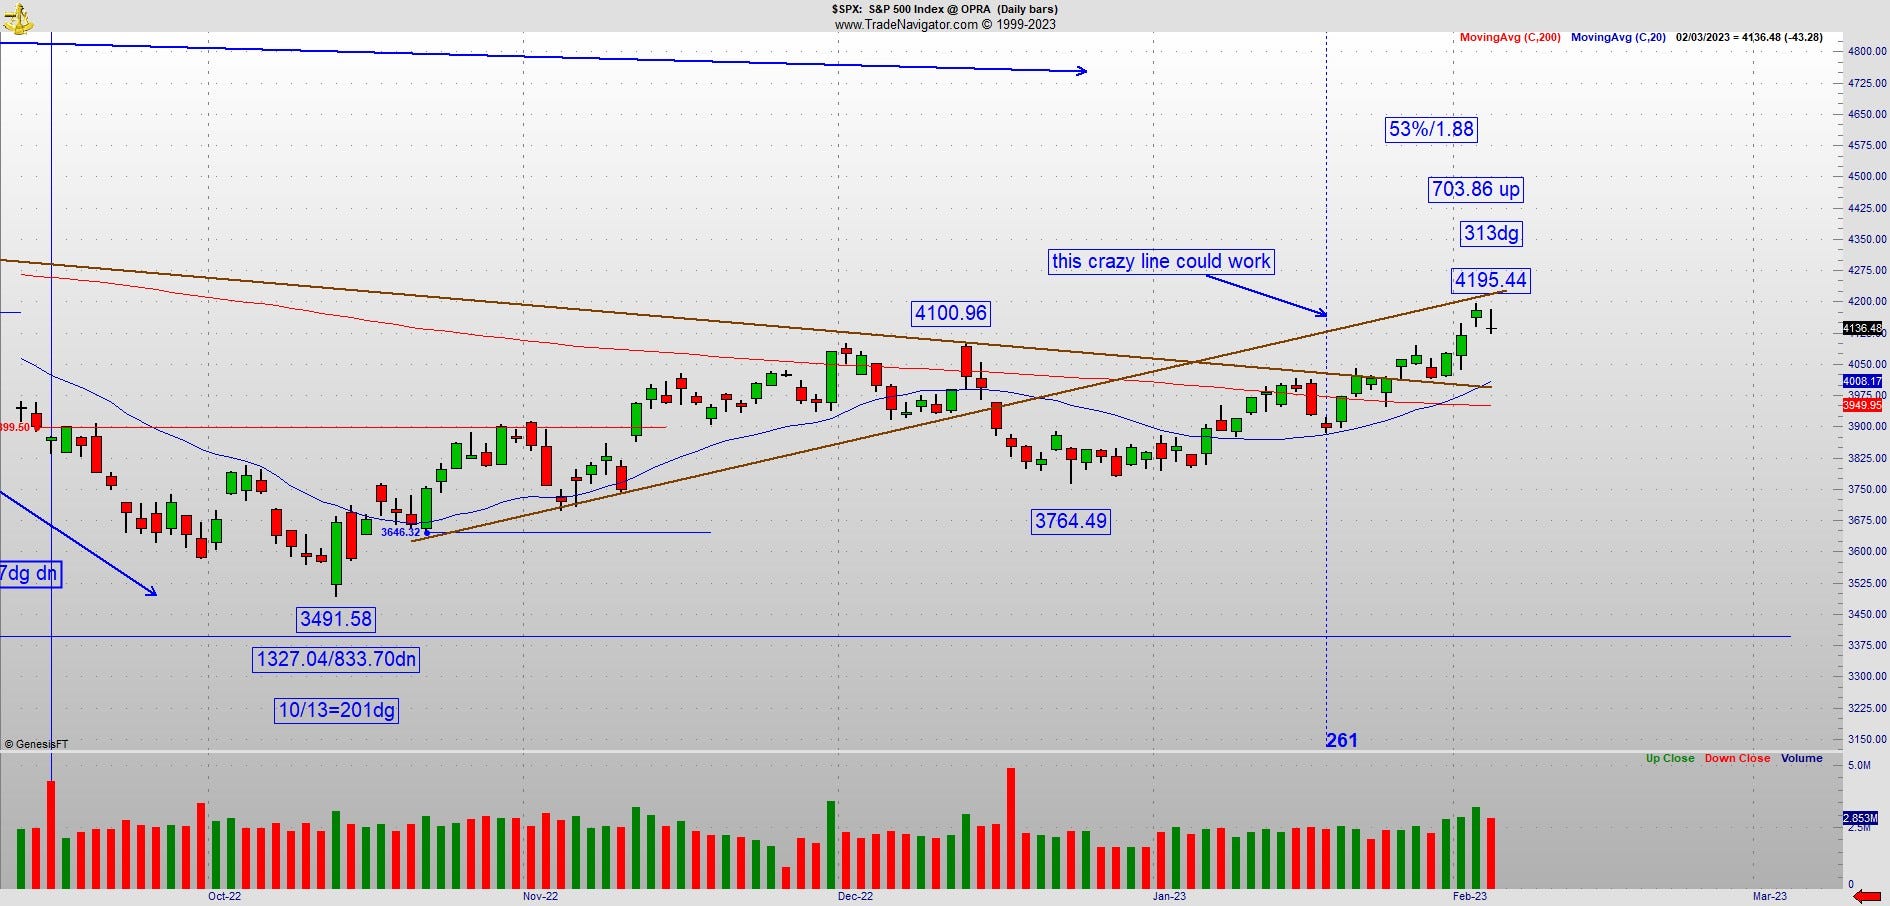
Lets go to the SPX. Here’s the daily and weekly. On the weekly, the Aug 16 high was 58dg up and a 58% retracement. Now we are 57 weeks off its top. See that balance line on the daily below? Sometimes these crazy lines do work so what was support in terms of the trend, the pattern is bumping into it now from below. Then Thursday and Friday were the 313-14dg days of the year. This is Pi 3.14 so that could mean something.
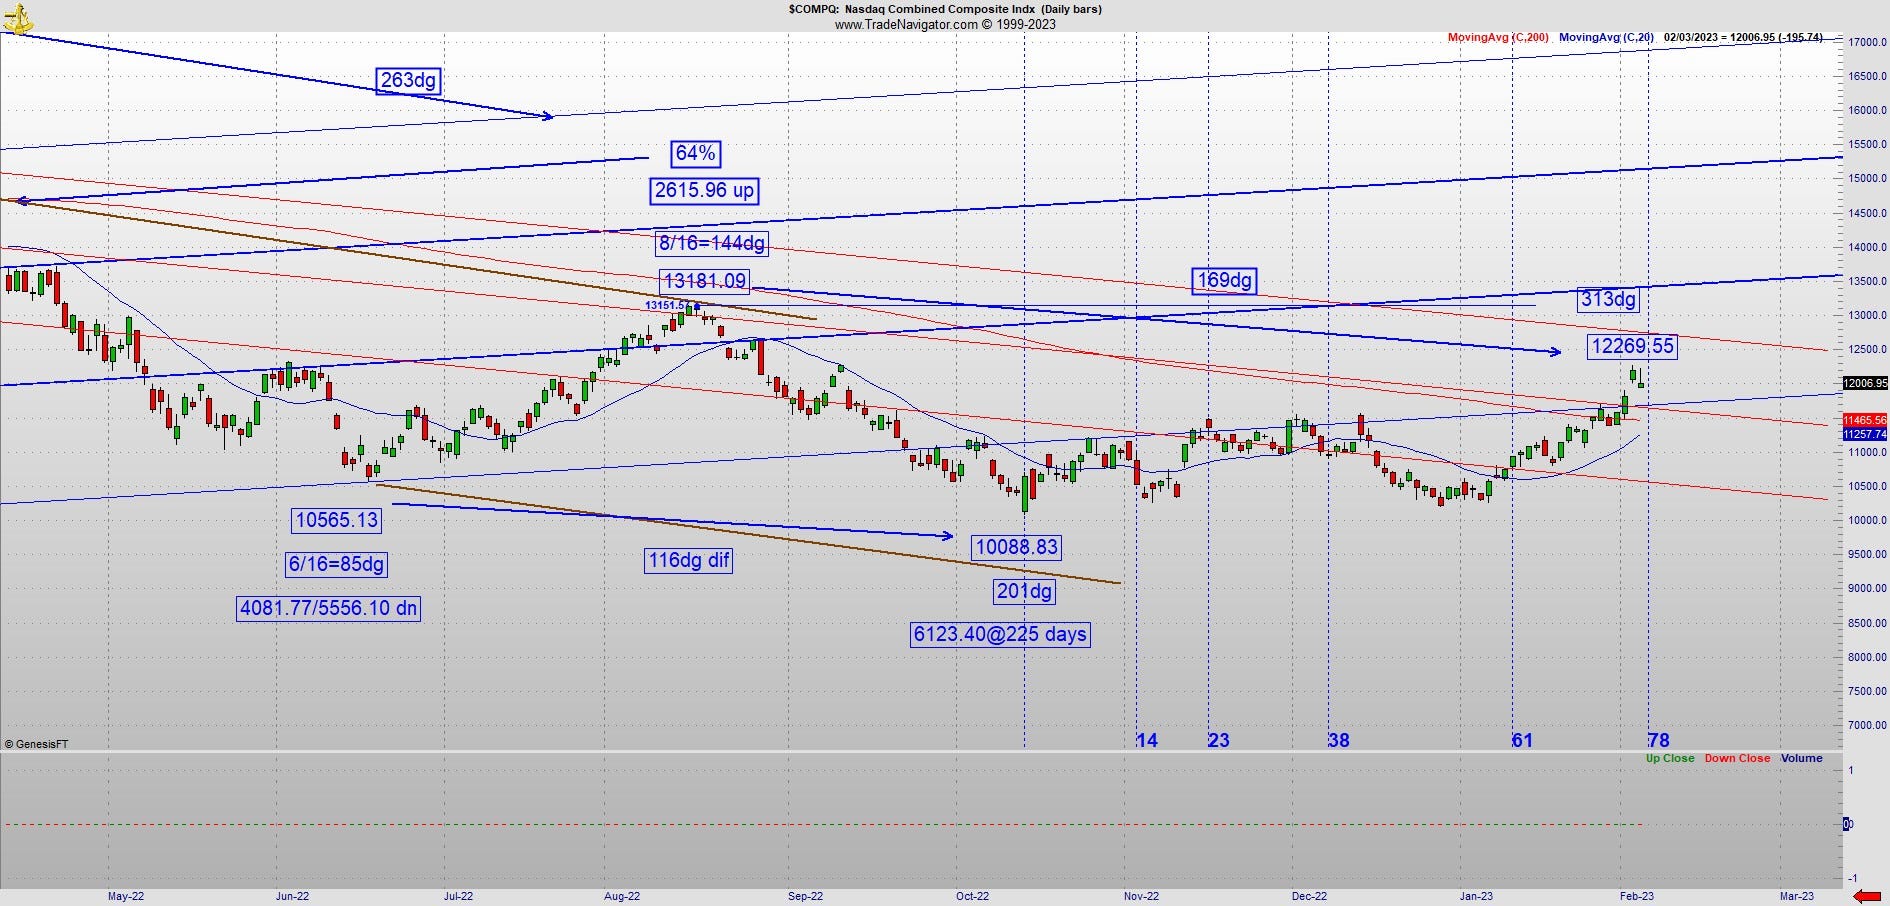
Lets look at the NASDAQ as we have something interesting here. August 16 was the 144dg day, now at 313dg the difference is 169dg and that wouldn’t mean anything unless we think about 13 squared is 169 and the price at the high is 12269! Conditions are ripe for it to rollover. What has to happen to spank these bulls, a black swan? This market condition is very one sided and way too many people are on the bull train. It could keep going but conditions are good right now for it to change direction.
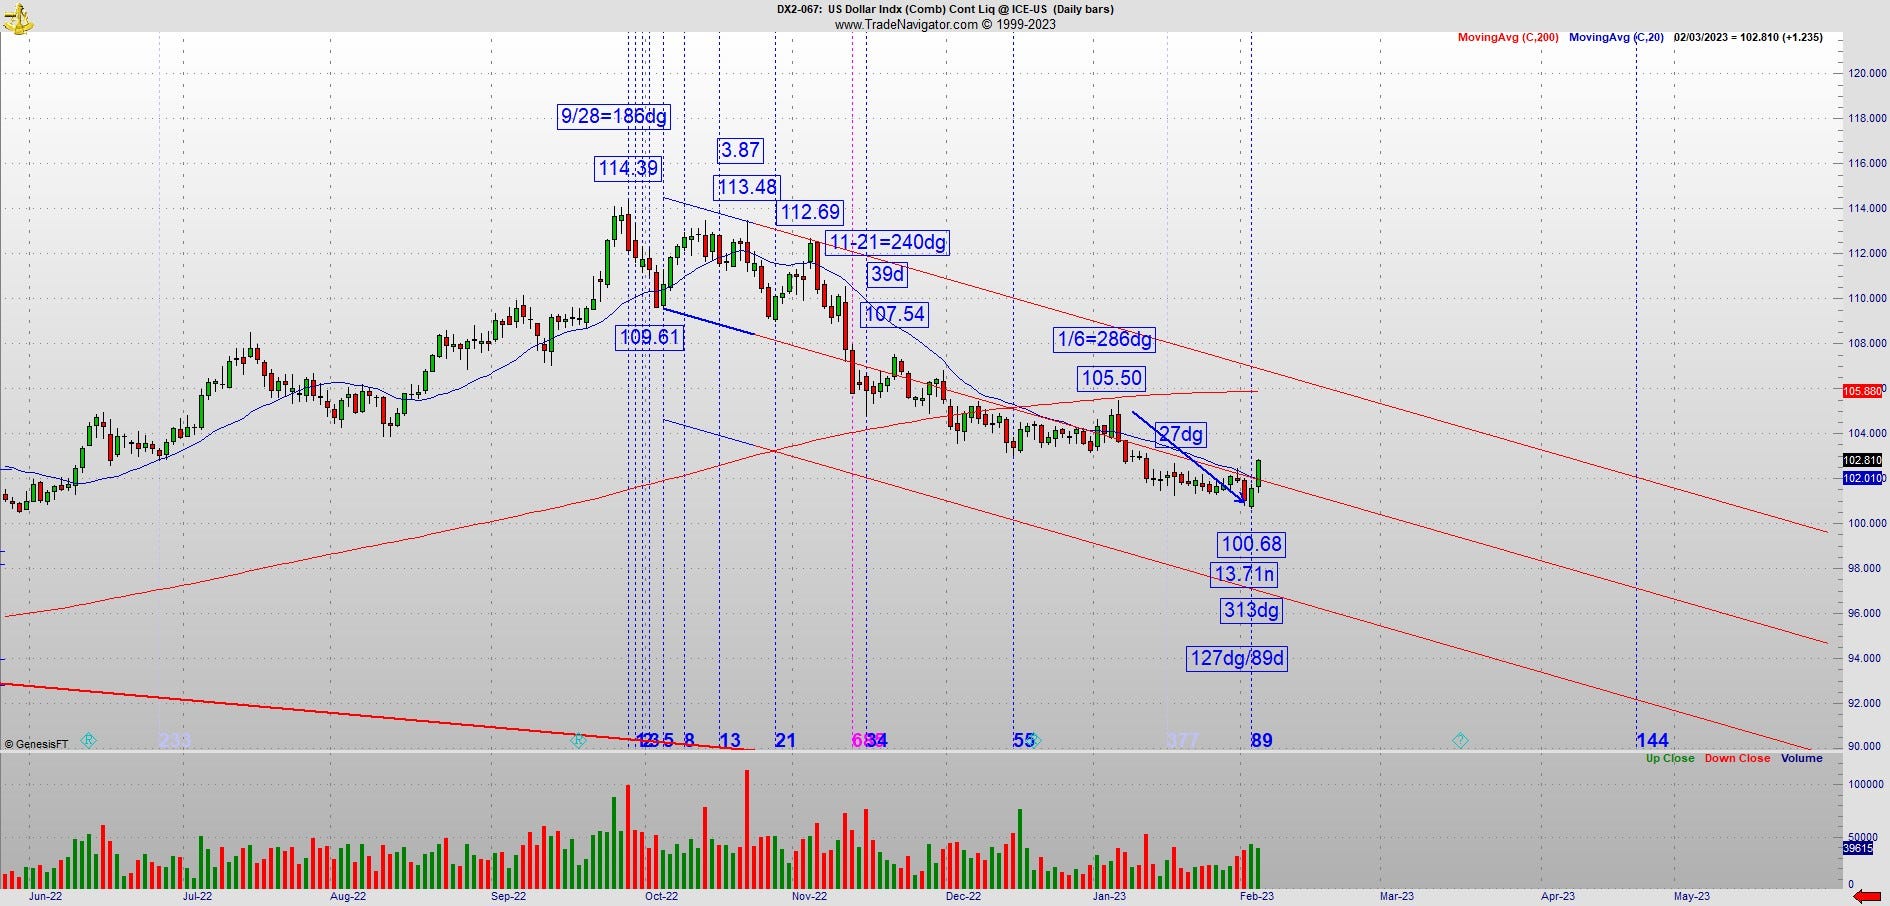
Finally, Dollar watch. It turned! We have some readings that could give it a decent trading bounce or even stabilize. You can thank Biden for giving us the best economy ever. The employment number was the lowest in 53 years! Imagine that. Okay, so what we have here is a leg down 89 days and 127dg on the Gann calendar. The match vibration is that last leg in January is down 27dg. So while this isn’t the kind of relationship that should give us a mighty rally, it could have some staying power. So if the Dollar goes opposite of the stock market, does that mean Bitcoin will roll over as well? I’m not showing Bitcoin today but its consolidating at important resistance.
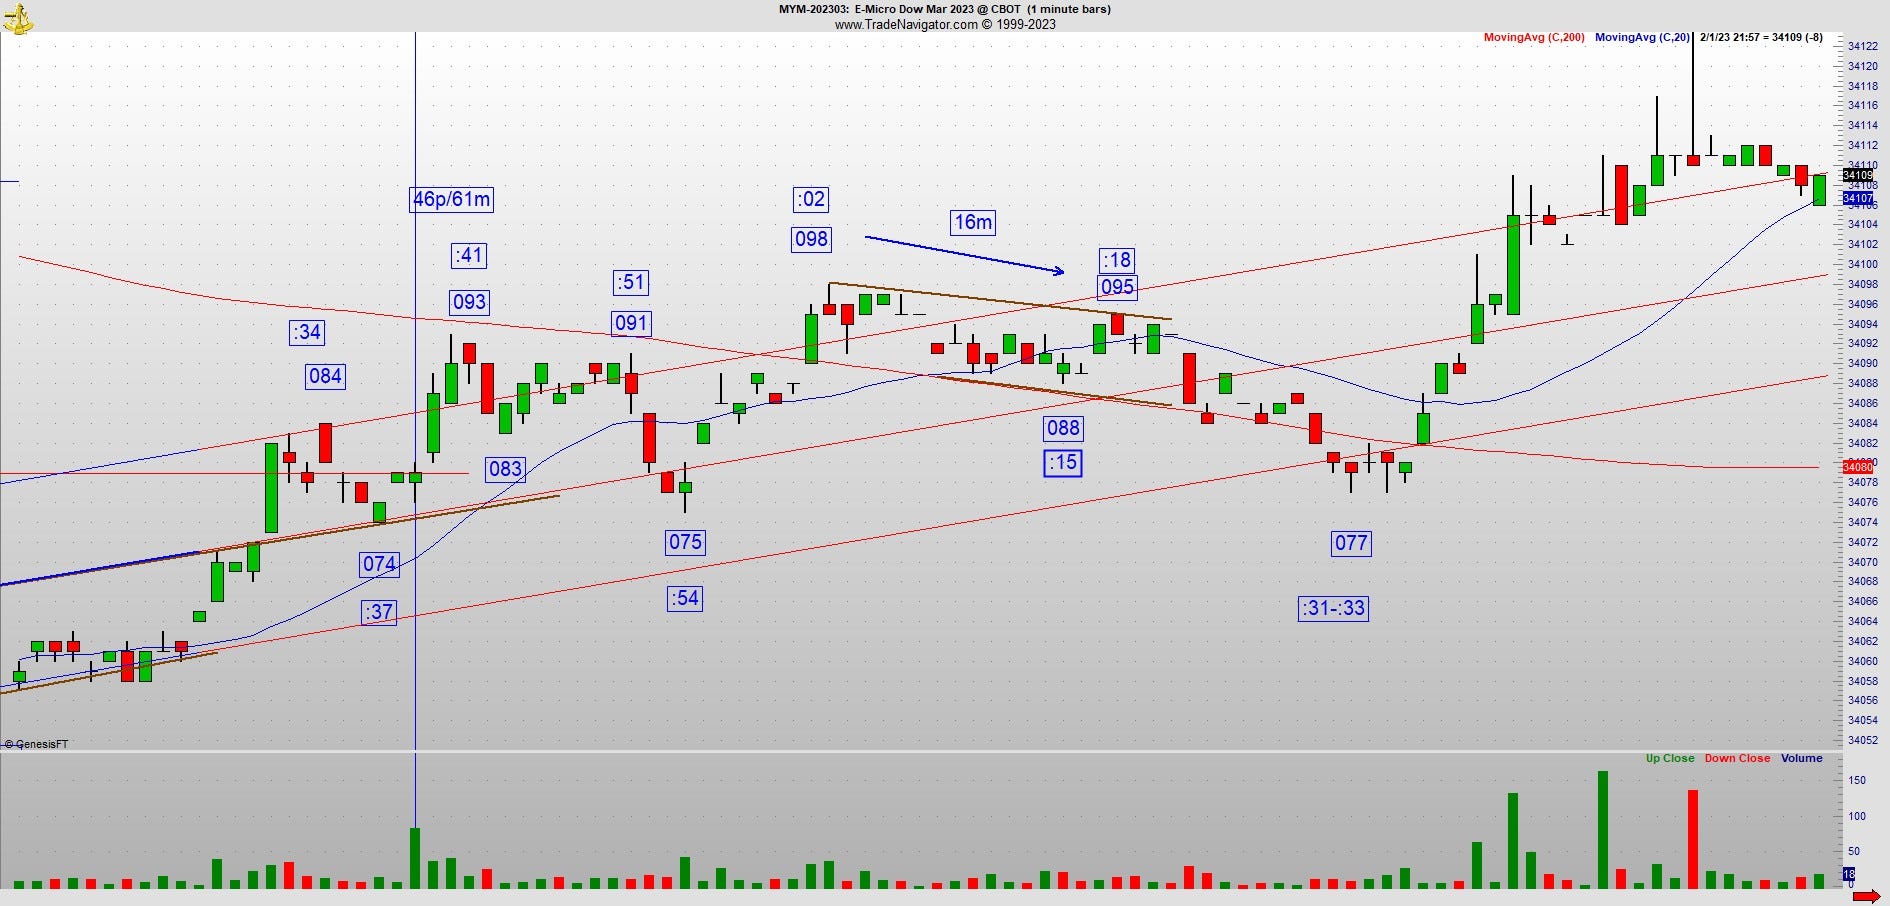
This was one of my more interesting trades of the week. Look at the arrow in the middle. Its 16m from high to high which doesn’t mean anything without the low at :15 on the 1 minute. The reason I had the conviction to take this was the proper drawing of the trend lines. Then you can see how it changed direction at the lower rising trend line. We know the vibrations but its important to work on doing the execution of the trade properly or you could be right about a move and still lose money.
Okay, I might as well tell you this. In the middle of December, I got a call from the Moneyshow people. Mind you I haven’t been in contact with any of them since March. As you know I’ve shared my differences with you. I’ve found an outlet where I can speak my mind and do my market work, its here. Its also on Twitter unless they turn up the shadow banning which they are doing. So out of the blue they asked me to speak at the Las Vegas Moneyshow in April. I asked a close circle of friends what I should do and they all said I should go. That was what I was thinking so I’m doing it. That doesn’t mean I’m going back there to write my weekly column, I’m here. I say what needs to be said. Then again, the right thing to do is forgive and so I did but that doesn’t mean I have to put myself in an uncomfortable position. So its this kind of thing I’m going to show the folks come my breakout session tentatively scheduled for April 26. They should be inviting me to Vegas as I’m in Phoenix which is basically in their backyard.
I can’t help myself, I have to show this as well. How did Kairos start? Some of you will recall I was asked to write a story for Futuresmag.com about 9 years ago concerning Fibonacci/golden spiral relationships. That did well so my friends at ICE (Intercontinental Exchange) asked me to do a webinar on the subject, so I did and in my preparation for this project I found that Fibonacci/golden spiral relationships only accounted for about 30-40% of all patterns. That disturbed me. Now I’m starting to believe the true number is closer to 30% than 40%. What about the rest? As you know it took me about a year to figure that out and you see the results. That being said, I’ve started playing around with different ratios and look what I found
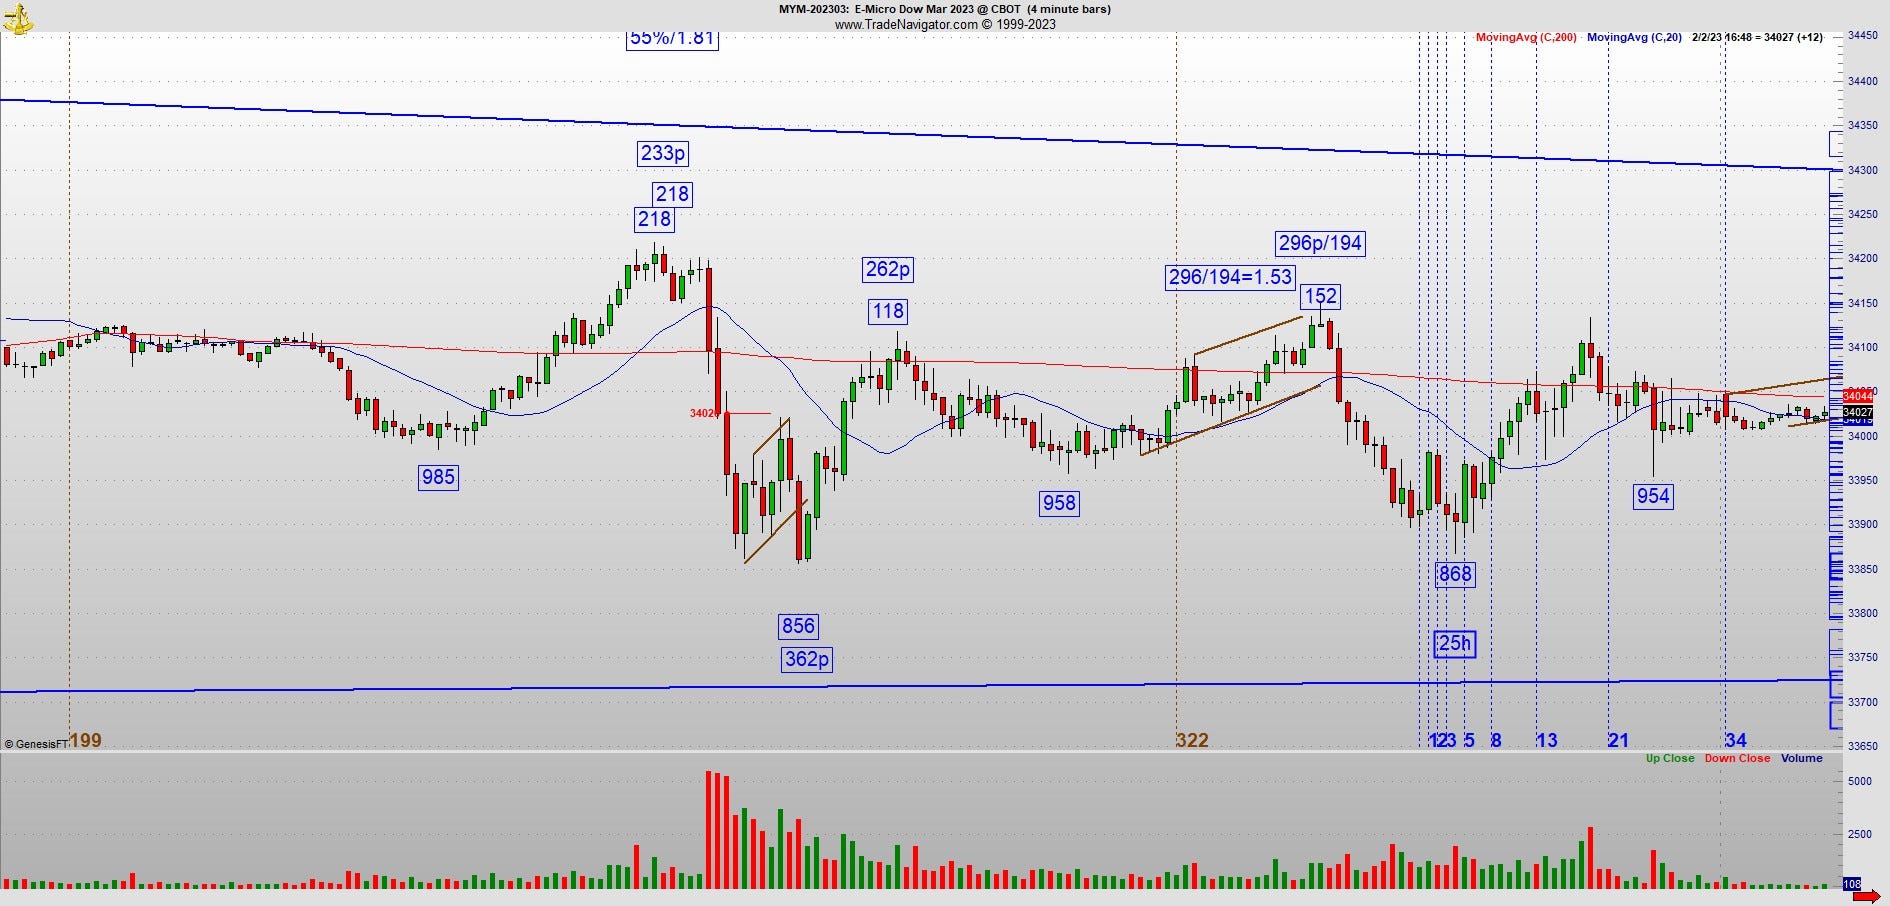
What you are looking at is an ABC up. First leg up is 262 points, C leg up is 194 points. The whole leg is 296 points. We want to find something that jumps off the page at us. So I’ll make it easy for you. The answer here is take the whole leg over the C. Take 296/194 and we get 1.525 or 1.53. What is the high? 152. How do you like that? Every leg has some relationship. The idea is to be able to track it, add to the readings as the pattern develops so when you think it could be a high, you won’t be left scrambling as these patterns move quickly. You had about 5 minutes to figure this out in real time. In 9 years I’ve come full circle. But the net result here is the ratio is neither Fibonacci nor golden spiral. For all you Elliotticians out there who’ve never been exposed to this sort of thing, its taken many years to truly master it. The true goal of the market is to line up price and time in such a way that even the ratio of the legs together can end up equaling the exact minute on the hour. So if you ever wonder why a move ends at :53 or whatever number, now we understand why.
Onward we go, it should be an interesting week.