
BE ADVISED NEW MARKET CALCULATIONS
BE ADVISED NEW MARKET CALCULATIONS
these charts are amazing

I hope you had a great Thanksgiving. Me? I had one of the best Thanksgiving meals ever. Our host did not serve turkey this year, she got some very high end salmon from one of those exclusive seafood markets from California. This was not the salmon you get in Trader Joe’s or any place like that. Not many people could pull off not doing turkey on turkey day but our gourmet host did it and it was one of the memorable Thanksgiving meals as most of the others seem to blend together where none of them stand out.
Now that its the holiday season the market is supposed to take on a more complacent perspective, right? We’ve been talking about this recently and markets are at a most interesting fork in the road.
Where do I start? Lets start at the top. I’ve been playing around with some of the very long term charts and I do that at least once a month. Most of the time, I don’t find anything that jumps off the page. This time was different. How many of you know that from the top of the Internet bubble to the high of this market in January its roughly 262 months? At first glance, that adds to the bearish case which was exposed at 664 weeks up from the 1265 2009 bottom in the NASDAQ.
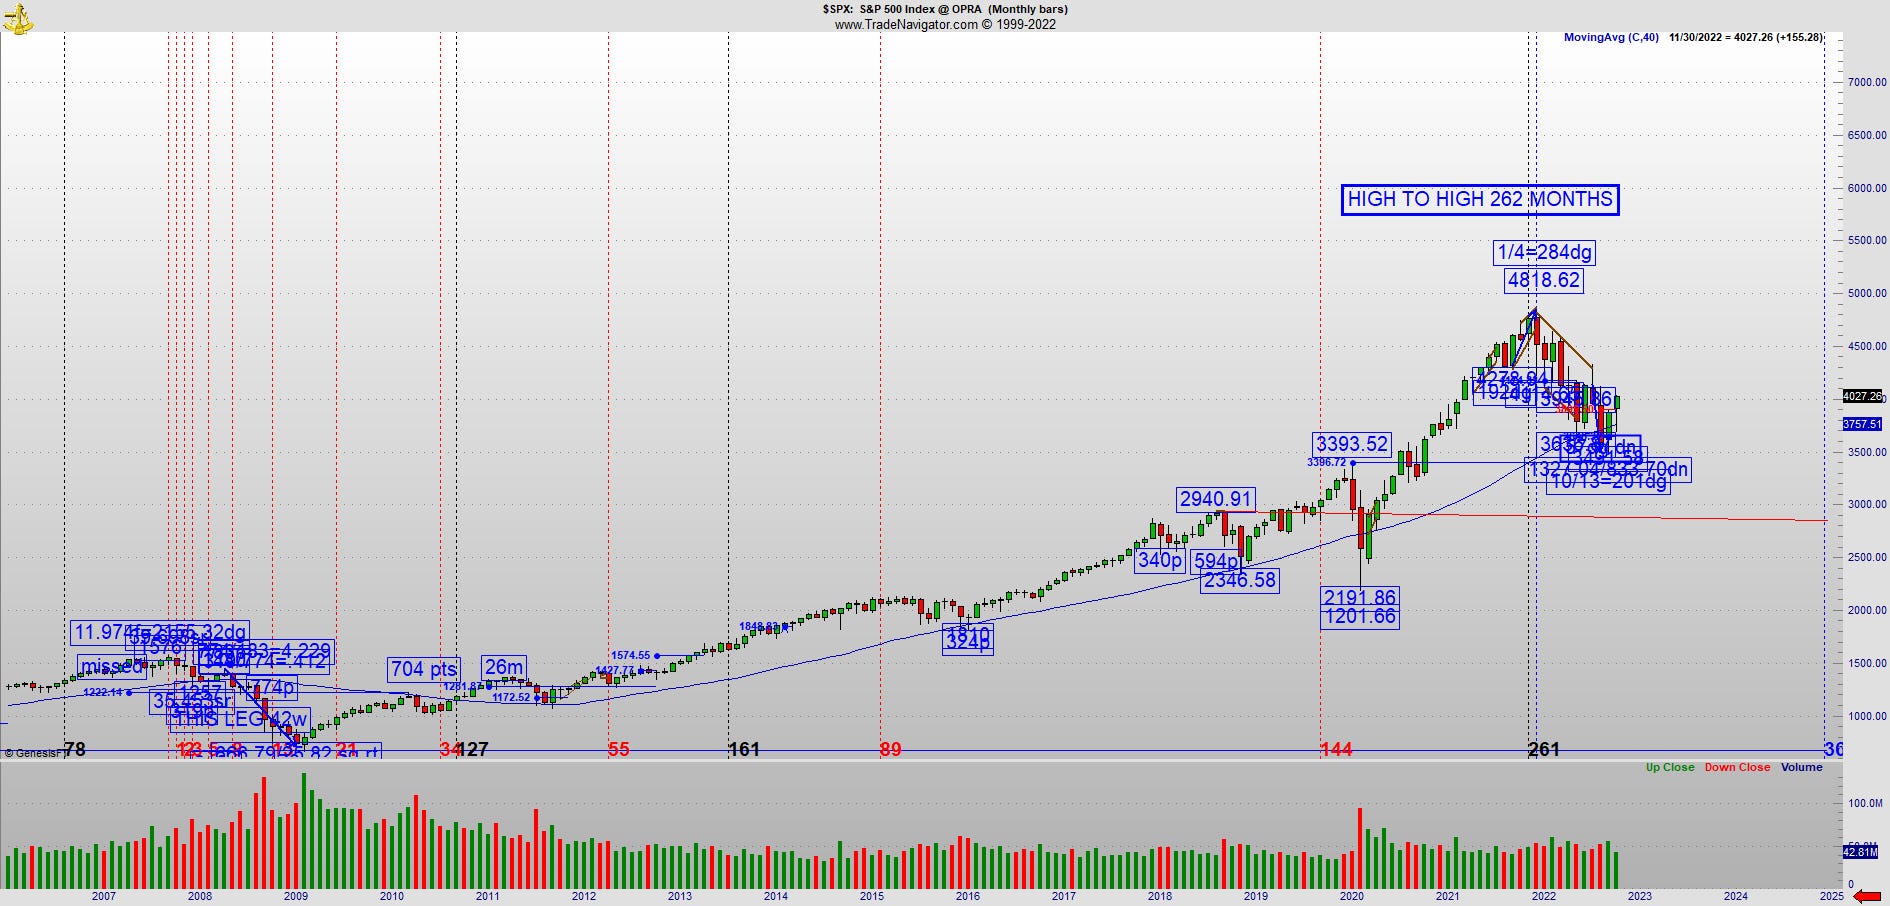
This chart is a mess and you can’t see much, don’t worry about that. It just shows us that high to high, its 262 months. But recall we had a low in October on some decent readings itself. So we were good there to alert you to that change. But we all know there was a problem with that low. It had no fear, the VIX was 35 and I don’t want to hear from the peanut gallery the VIX no longer matters. So we had some very nice short term readings in November and I’ve called them out either here, Twitter or in my iContact posts..By the way, we are still on Black Friday/Cyber Monday discounts, see the iContacts you may have received this week or get in touch with me for more information. Its been bullish, no doubt about that.
But now we are at real overhead resistance and to be frank with you, as an intraday player, I don’t really care which way the market goes AS LONG AS I UNDERSTAND IT. I need to know the quality of the vibration at a pivot turn, that’s so important. So this bounce has been a little perplexing in that regard. But there is one chart that reveals the bottom line and I had to see it get some follow through before taking it seriously. Luckily for me AND YOU, I caught it just in time.
When the market turned back up in 2009, it took me at least 6 months to crack the code. What I found was the bottom in the SPX at 666.79 had a square root of 25.82 and the 09 bottom was 258 months from the top of 1987 crash leg. When I saw that I might have been the only one in America who could technically prove the bottom was in. Don’t laugh, sentiment at that time was the crowd still preparing for a leg down while I was and stayed bullish for the next 10 years. This time its a little different but it did take me 5 weeks to get a handle on this turn but still in time because I’m here to tell you about it before the reaction.

So here’s a clean chart of the DIA, the Dow Diamonds, I can’t put up the Dow because its too messy. Here’s the point, the October bottom is 163 months off the 2009 bottom.
Did you get that? As you can see on this monthly chart, it wouldn’t have meant anything had we not achieved some follow through on a bullish engulfing candle on a large oil tanker like monthly time frame.
This could change EVERYTHING. Yeah, the economy is still in big trouble and this time its not a wall of worry. Yes, we are worried about events and geopolitical situations. But these are not normal considerations. That’s when one has to consider historical charts to other periods similar to this. Unfortunately, there are not many test cases because WWII was a big event.
I hear our enemies are fixing to implement that digital currency which will be a complete disaster. They are already beta-testing it now. What if they do implement a CCP style credit score system here? Its not going to be good and that’s an understatement.
So we are at key overhead resistance and if it breaks through, we’ll understand why. I personally believe its part of my job description to catch all market calculations on a timely basis, I’m talking about important stock market pivots. I got this one by the skin of my teeth. Basically, we now have a market (confirmed technically) that is stuck between 2 excellent longer term golden spiral readings 262 at the top, 163 at the low ON A MONTHLY TIME FRAME. That’s huge. Still the high should be stronger than the low because it took an extra 100 months to form. But what does it mean to the rest of us?
I have no idea…I’m kidding.
I don’t make these predictions as nobody knows what will happen but when I see stuff like this on smaller time frames it usually leads to a trading range type of market. This could be a 1 minute or an hourly or a monthly. What that could mean we might be in a 1970s style bear market where it stayed in a range for nearly the whole decade. One thing we have in common with the 70s is killer inflation and you might recall at one point interest rates hit 18%. I know because while I was in college I got a real estate license and my very first deal fell out because they couldn’t close escrow as rates went up too quickly and the buyer could not qualify for the loan. So I’m not going to sweat this test of the August 16th peak which was perfect in terms of the Gann calendar on a daily when the condition on a longer term monthly could be activating. Another great chart is the SPY. I was emailing one of my clients who takes a special interest in the SPY so I thought I’d take a look and see for myself. This is what I found.

There is so much good stuff going on here. First of all the top came in on a 284dg vibrational day on the Gann calendar. Then we go to the March 29 pivot which led to the biggest drop leg and that was 84dg distance on the Gann calendar in terms of time. Then the last leg to the low has a range of 83.62 which rounds to 84. See how that little Gann calendar works? It will give you degrees in terms of time and then the very same number can switch to price distance. That’s the power of replication and you know I did a manual called Replication is the Holy Grail. Now you can see why. So right now the SPY is 31 days up and the prior high was 431.73. Sunday is the 246dg vibrational day of the year. That means its 102dg from the August 16th high and that’s not important until you see the low of the market came in on the 201dg vibration day. So its 201dg at the bottom and as you read this 101-102dg from the August 16th high.
All of this should lead to an important reaction and depending on what happens we’ll have a much better idea of the longer term picture not to mention whether overhead resistance holds or not. The red lines across the screen represent key selling entries and if this thing blows bullish for whatever reason we could get the mother of all short squeezes. Look, I just want a nice thrust to trade but we could be setting up for something extraordinary. If for whatever reason it fails right here, then we’ll see how strong that 163 month pivot at the low really is. There’s something also very interesting on the longer term oil chart.

What is it with these 84s? The rest of the stock market did top on a 284dg day. On this chart the peak on June 14 was the 83dg vibrational day of the year and the September 26 low was the 184dg vibrational day of the year. People ask if the Gann calendar really works. To that I say look at the precision on these charts! Why are we talking about this? Because the recent low on this 056 longer term chart is currently sitting at 184 days off the high. So this is a big test coming, just as we start the new week.
So much going on and this was just a short trading week. So can you come to appreciate the market doing all this important testing and vibrating right as Santa rally season gets started.
To wrap up I’m going to leave you with some good news for a change. One of the best lawyers around, a fellow named Loy Brunson sued at least 1/3 of Congress and others and SCOTUS decided to hear this case on an expedited, emergency basis. He claims Congress has all the evidence from 2020, not to mention issues relating to the jab. This guy is a great attorney and all I can tell you is he was explaining his case on Caravan to Midnight this week and it sounds really promising. I listened to this guy and he seems to have found some little known statutes Congress has violated (as well as this criminal cabal in charge). He’s really good at connecting dots nobody thinks about. The Dems have been taken by surprise. He calls what he’s doing a counter revolution. Practically nobody knows about this unless you are a Caravaner. What we all need to do at this point is pray SCOTUS does the right thing this time. I have my doubts but I will pray for Mr. Brunson, his case and the good of the country as this could be our last best shot. John B. Wells came out and asked him specifically about what he thought of the enemy launching their digital system before Christmas. His reply was he thinks the enemy is going to be taken by surprise around the time the new Congress convenes in January. I don’t know, I hope for the best. This is the best news I’ve heard in a while and I want to encourage and give you some good news going into the holidays. I think it has a shot.
If nothing else, we covered a lot of ground today and you got a good chance to see how to track patterns on the Gann calendar as it can be foundational to the price and time square outs which does help reveal the pattern to us traders as it develops. Get in touch with me via email lucaswaveman@gmail.com for information on our Cyber Monday deals.